Quick structural analysis of the 30 amino acid mutations on the SARS-COV-2 Spike protein omicron variant
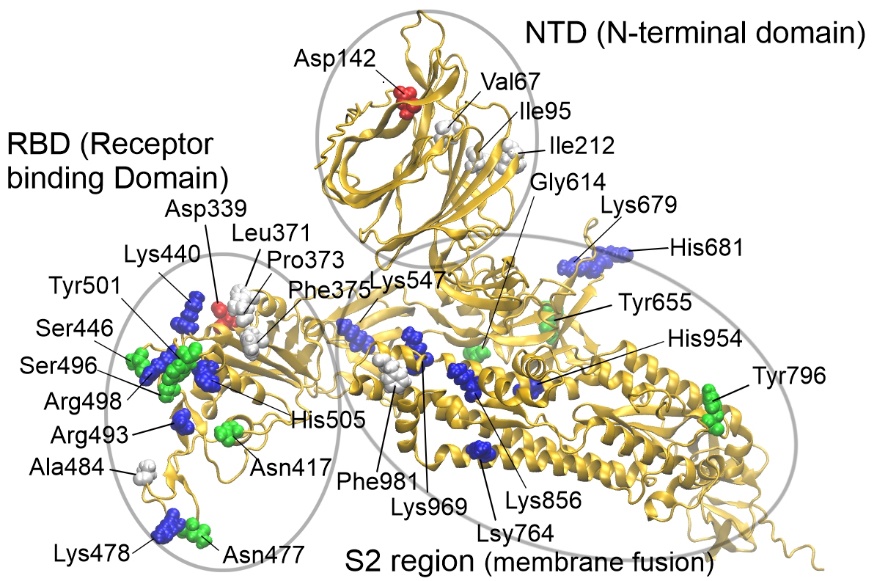
Fig. 1 The protein model was generated by AlphaFold2. The C-terminal region (virus membrane anchor) of the spike protein is not illustrated.
The following two figures show pairwise comparisons to the alpha and delta variants, respectively. Electrostatic potential maps were calculated with Adaptive Poisson–Boltzmann Solver (APBS) using the linearized Poisson–Boltzmann method. The partial charges in the electrostatic potential were calculated with PDB2PQR. Molecular graphics were created with VMD and PyMol. On the electrostatic surface models, red color represents regions with a potential value less than -2.0 kT; white color shows 0.0; blue shows regions greater than +2.0 kT.
Alpha vs. Omicron
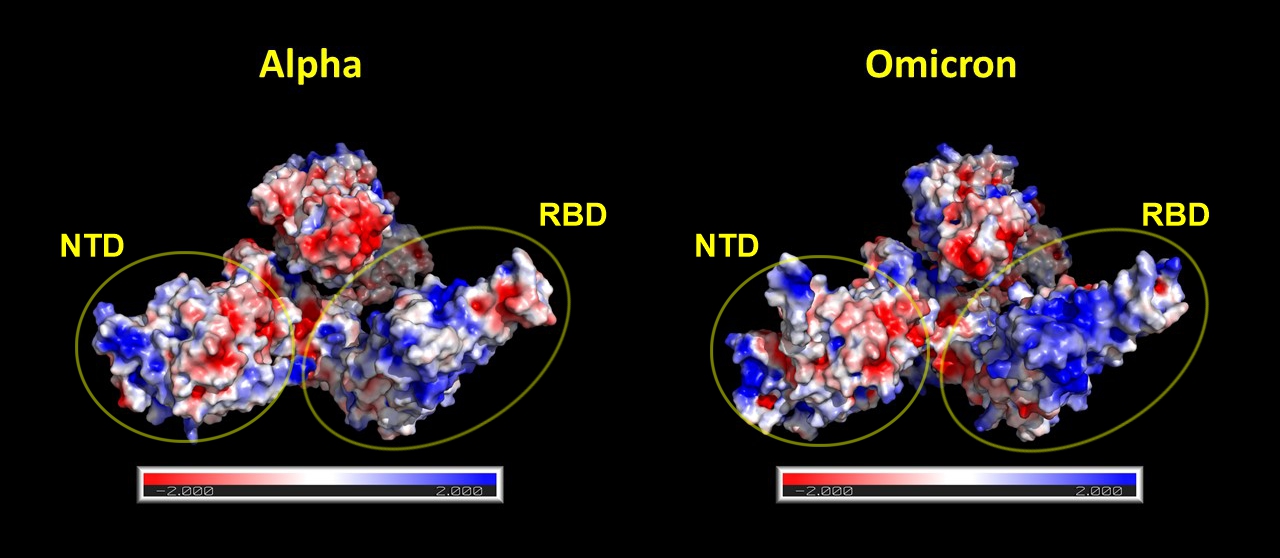
Fig. 2 Omicron has slightly different 3D structure than Alpha. A more significant change is that it has significantly more positive charges (blue) in the RBD.
Delta vs. Omicron
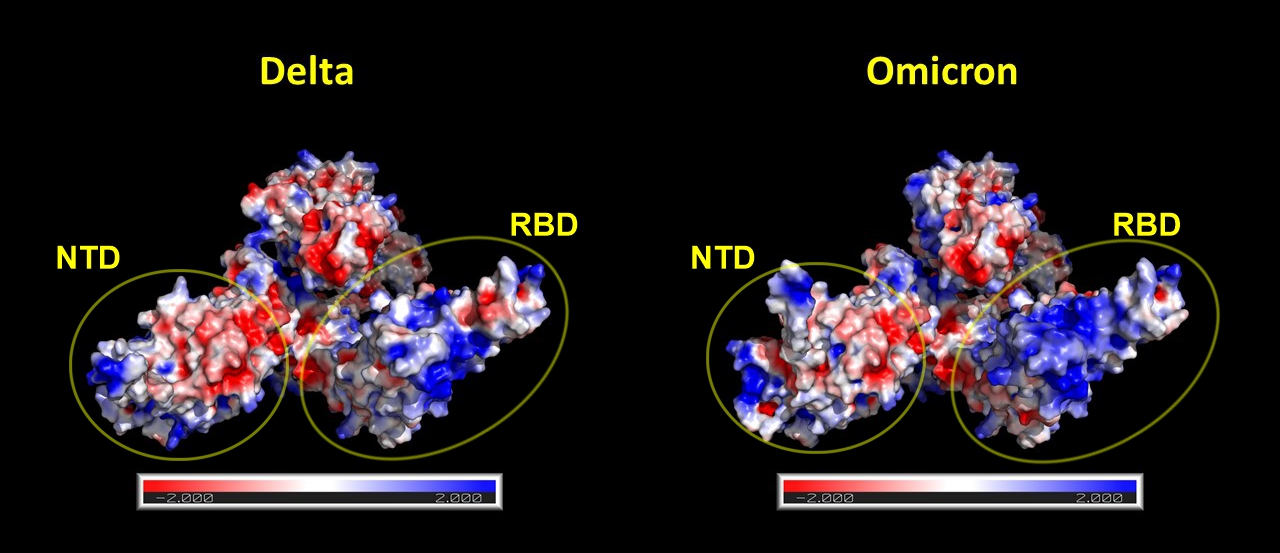
Fig. 3 Omicron has slightly different 3D structure than Delta. A more significant change is that it has significantly more positive charges (blue) in the RBD. The difference is larger than it was between Alpha and Delta.
Interpretation
Half of the variant determining mutations are located on the Receptor binding domain (RBD) of the spike protein. As a result of these mutations, it is likely that the spike protein can bind to the ACE2 receptor with even greater affinity. Due to these mutations the electrostatic potential surface of the RBD became more positively charged. So the immune system has to generate such antibodies which bear more negatively charged CDR loops to neutralize the mutated RBD region. However, it is well known that antibodies that contain many charged amino acids in the CDR loops have a shorter lifespan [1,2]. Taken together, these findings suggest that the immune response against the new omicron variant will be even less persistent than in the previous variants.
References
Sharma VK, et al. (2014) In silico selection of therapeutic antibodies for development: Viscosity, clearance, and chemical stability. Proc Natl Acad Sci USA 111:18601–18606. (PMID: 25512516)
Matthew IJ, et al. (2019) Five computational developability guidelines for therapeutic antibody profiling. Proc Natl Acad Sci USA 116: 4025-4030 (PMID: 30765520)